
 Full Text (PDF)
Abstract
This study examines the role of visualization in teaching chemistry and explores students’ challenges in linking them across Johnstone’s three levels of representation: macroscopic, microscopic, and symbolic. Chemistry, being such an abstract subject, is problematic, as students often fail to connect these levels of representation. This contributes to a view of chemistry knowledge that is fragmented through levels of representation, and many students rely on rote memory rather than meaningful learning. The data collection process consisted of 211 completed surveys from undergraduate science students from The City College of New York. Surveys included Likert-scale, multiple-choice, and open-ended questions to assess students’ learning styles, the ease or difficulty level they felt associated with their participation in the science, technology, engineering, and mathematics course, and their usage of visualization tools. Overall, data showed that most students identified as visual learners (63%), and that visual tools in learning contexts were neither consistently implemented nor appropriately used throughout their coursework. Participants indicated that, for the purposes of memorization, advanced formulas and practice problems were the hardest aspects of their studies and mentioned that visual processes such as diagrams and cycles were the most useful. Video, charts, and diagrams were seen as the most useful tools when working with visualizations, while physical model kits and demonstrations lacked the effectiveness for bridging the three levels of representation. In summary, visualization techniques remain valuable and underutilized. Additionally, for chemistry education to be improved, it is equally important that visualization tools are at the support level for learning at the individual levels. These visualization tools should also be deliberately scaffolded to connect macroscopic, microscopic, and symbolic levels.
License
This is an open access article distributed under the Creative Commons Attribution License which permits unrestricted use, distribution, and reproduction in any medium, provided the original work is properly cited.
Article Type: Research Article
INTERDISCIP J ENV SCI ED, Volume 22, Issue 3, 2026, Article No: e2619
https://doi.org/10.29333/ijese/19007
Publication date: 24 Jul 2026
Article Views: 1070
Article Downloads: 490
Open Access HTML Content Download XML References How to cite this articleHTML Content
INTRODUCTION
The science, technology, engineering, and mathematics (STEM) fields call upon both students and educators’ ability to conceptually grasp and bridge ideas and themes across several complex levels. This requirement is not specific to just STEM related disciplines, but STEM requires an additional level of proficiency in problem solving, interpretation of information, and the ability to translate it across multiple domains. It often relies on the techniques of visualization and modeling to build foundational understandings of the chemical concepts taught in the classroom or laboratory setting to do so. This is because much of what STEM fields focus on are beyond the tangible and visible scope of our everyday lives.
The study of chemistry represents a particularly challenging discipline due to its abstract nature. It requires the synthesis and application of theoretical frameworks, married with symbolic representations of chemical processes, to better orient learners so they can understand what is occurring at the microscopic level. Chemical concepts of chemistry have been taught by using specific techniques, also known as Johnstone’s three levels of chemistry representation. These three levels of chemistry are separated into three levels to make the abstract nature of chemistry education more familiar and comprehensible. These three levels include macroscopic chemistry, microscopic chemistry, and symbolic chemistry.
Chemistry itself is a visual science. It relies heavily on the visual reasoning skills of the student, where they take clues from observations at the macroscopic level to retroactively synthesize what has occurred at the molecular level. The observer is then tasked to communicate this knowledge, relying on symbols and representational chemistry to demonstrate their critical understanding of the subject at large. This task requires a fundamental level of chemical literacy along with the ability to move between the three different levels of representation, knowing how to manipulate the chemical information to be discussed at each level.
The effectiveness of school chemistry teaching is predominantly dependent on the teacher’s ability to communicate and explain abstract and complex chemical concepts and on the student’s ability to understand explanations (Treagust et al., 2003). Effective teachers must present information at the correct level for the students, make use of relevant models or examples, build on the current knowledge and concepts that students already understand, and provide students with as much information as they need without going beyond their grasp or oversimplifying the content (Treagust & Harrison, 1999). To accomplish such tasks within these parameters, tools such as graphs, mathematical models, tactile ball-and-stick blocks, and hands-on experimental demonstrations are all employed to represent the manipulation of matter, materials, or molecules beyond the scope of optical observation and communicate how certain ideas are related and are used in chemistry education.
Visualization as an education tool encourages students to build mental images based on what is seen or heard. It aids in information processing and is a root component of memory, concept formation, and spatial and analytical skills. It bridges what we see in ordinary vision to an extension of the concepts that students are taught verbally or on paper. However, visualization is a personal experience and considered subjective when not properly guided. Those who are unfamiliar with the concept or lesson at hand can conjure up different realities based on their own interpersonal understandings of the subject. This makes implementing visualization tools and examples an incredibly challenging resource to implement in a pedagogic setting. Without structured guidance, learners can mistakenly attribute certain representations of shapes, bonds, colors, sizes, and state changes to erroneous conclusions.
The intent of this research is focused on how educators can better bridge each component of the triplet knowledge through visualization to streamline the overall ideas and concepts occurring in a particular chemistry lesson. By focusing on the visualization techniques used at each level, science educators can better address the misconceptions and challenges that arise in student’s scientific learning when using certain visual aids, models, or representations. The question then becomes, how do we optimize visualization strategies not just for each singular level of chemistry, but as a resource that helps students incorporate the three representations to better understand chemistry holistically? This research hopes to accomplish the identification of the gaps and misunderstandings that prevent this from occurring.
The idea of visualization can be defined as follows:
-
the representation of an object, situation, or set of information as a chart or other image or
-
the formation of a mental image of something (New Oxford American Dictionary, 2021).
Science teachers and education researchers have recognized the importance of visualization as a primary tool in chemistry learning. The use of visualization tools to teach chemistry has been a primary focus of chemistry education research, with the idea that using visualization models will promote the formation of mental images in students to better connect the macroscopic and microscopic realms of chemistry (Williamson, 2011). To investigate natural phenomena through ideas of molecules, atoms, and subatomic particles and their relationships, chemists have created a variety of representations such as molecular models, chemical structures, formulas, equations, and symbols (Hoffmann & Laszlo, 1991). These representations present chemical concepts that may not be easily understood otherwise, allowing students to improve their overall performance (Larkin & Simon, 1987). Visualization tools implemented in the classroom include but are not limited to physical models, experimental demonstrations, computer modeling, role play, animations, student- or teacher-generated drawings, interactive computer programming, or some combination of these.
Collected research has shown that the implementation of visualization can foster students’ learning of the microscopic world and that visualization tools and models are valuable resources for teaching and learning chemistry. Such techniques help students understand three-dimensional structures (Williamson & Abraham, 1995), assist in developing spatial abilities (Barnea & Dori, 1999), reduce students’ misconceptions of chemical principles (Kozma & Russel, 2005), and increase motivation when learning about chemistry (Tsui & Treagust, 2004). Noh and Scharmann’s (1997) study indicated that instruction with visualizations of the molecular level can help students construct more scientifically correct conceptions about the microscopic world. Visualization is a pedagogical technique and is a valuable one across the sciences. Specifically, it lends itself to demonstrating the relationships across the three domains (macroscopic, microscopic, and symbolic) of chemistry. Present at each individual level, educators can implement different types of visual representation to better scaffold scientific relationships across all three domains of chemistry for students.
Chemistry is a discipline of science that relies on someone’s ability to decipher layers of information. It calls upon learners and educators to take observable changes and pair them with theoretical scientific concepts. Often what is identifiable at the physical level does not directly translate for students to what is occurring at a molecular or atomic level. With little conceptual foundation, students are tasked with navigating the scientific world without supporting language, maps, or relationships to help them synthesize and bridge chemical science lessons as interconnected pathways.
Chemistry itself is a discipline that relies on the relationship between the three representations of chemical thinking: the macroscopic, the microscopic, and the symbolic domains (Eilks et al., 2012). This methodology of teaching science to students was proposed by Alex H. Johnstone from the University of Glasgow in the late 1970s. It aimed to make science less difficult to learn by building a framework based on human learning that centered the three main levels at which chemistry was commonly taught. It broke down chemistry into three main domains. Each domain focused on a specific framework of chemistry: one that can be visually observed (macroscopic), another that could be manipulated in relation to equations (symbolic), and another that illustrated abstract ideas at the microscopic level. Johnstone’s proposal of chemistry organization was a triad model that borrowed concepts from human learning. Johnstone took note of the fact that many students claimed that science is hard to learn, suggesting that scientific concepts and materials are not being successfully transmitted (Johnstone, 1991). Johnstone’s original perspective centered on the macro, micro, and symbolic levels, which represented different levels of thought, an interpretation by an information-processing model of learning (Taber, 2013). Johnstone’s model has been almost ubiquitously integrated into all education levels of chemistry teaching.
These different domains of chemistry have been interpreted in several ways. To some they represent levels of thought (Jaber & BouJaoude, 2012), or how certain chemical ideas can be represented while teaching (Gabel, 1999). However, implemented, there are still visible challenges in marrying all three to successfully convey information to students. The following sections expand upon the definitions of each level of Johnstone’s triplet and how visualization is implemented to teach each, along with common challenges in teaching and learning at each level. Further, the primary challenges and gaps that are incurred are also noted.
Many students are introduced to chemistry at the macroscopic level. Whether it be during primary schooling, where educators engage students with experiments to showcase color change, phase change, or chemical changes, these can be experienced directly by students, allowing them to build mental frameworks of foundational science through observation. The macroscopic level of chemistry is related to the observable phenomena such as melting ice, burning a candle, or color change. Teachers may use definitions of concepts and everyday experiences to teach the topics at this level (Tuysuz et al., 2011).
The macroscopic level includes observable and tangible concepts that can be experienced in our daily lives or observed within a classroom demonstration. Throughout science education research, the macroscopic domain spans a variety of definitions, including
“the macroscopic level is the observable chemical phenomena that can include experiences from students’ everyday lives such as color changes, observing new products being formed, and others disappearing” (Treagust et al, 2003).
It is these types of visual demonstrations that help students build mental maps between the observable experience and the theoretical or abstract material being presented (Bransford & Donovan, 2005). Based on macroscopic observations alone, it is relatively common for students to develop misconceptions about what is occurring without the integration of other domains of chemistry as explanation.
Research in science education reveals how students maintain alternative conceptions about scientific models (Grosslight et al., 1991). This is often due to the fact that science educators use macroscopic experiments to explain certain phenomena but do not go further to explain the assumptions or gaps that are not explicitly resolved in the tutorial or experiment (Hitt, 2006). Researchers emphasize that educators must stay at the macro level until students have formed new conceptual understandings before introducing the explanations based on the micro or symbolic reasonings (Johnstone, 2007).
Chemistry remains a particularly complex subject for the introductory learner because there are numerous concepts that can be observed at the macroscopic level but can only be explained at the microscopic level (Gabel, 1999). For introductory learners, using visual models or tools allows students to see, touch, and manipulate abstract information, which helps them develop a deeper understanding of the scientific concept at hand (Hitt, 2006). Since much of the science can be observed by the senses at this level, a reliance on visual models or aids is less emphasized when focusing on macroscopic-level chemistry. The challenge of the macroscopic level is not in the implementation of models or visualization tools in the classroom, but instead in ensuring that students are able to process tangible observations into foundational concepts for more advanced levels of learning. The difficulty comes in explaining the reasonings strictly within the confines of a macroscopic domain. The introduction of the other intangible levels of chemistry must be gradual to avoid confusion but timely enough so that students do not incorrectly attribute information based on visual relationships alone. According to educational psychologist Jerome Bruner, for students to fully understand a concept, they need to have experience with it at all three levels (Bruner, 1966).
The symbolic level of chemistry is often referred to as a language. Throughout the subject area, symbolic representation takes a wide variety of forms. According to Johnstone (1991), the symbolic level represents chemical and macroscopic phenomena communicated by the use of chemical equations, mathematical equations, graphs, reaction mechanisms, analogies, and model kits. The symbolic level of chemistry includes the utilization of specialized language (and symbols) to refer to nomenclature, elemental symbols, units of measurement, subscripts, atomic numbers, phase labels, Greek letters, and numerous other indicators that are used to denote chemical properties, quantities, and relationships. Just like in any other language, such letters and symbols represent not only specific chemical values but also processes such as reactions. It requires a coordination of previous knowledge, problem-solving skills, and a working ability to predict and interpret the information given to students in order to fully comprehend what is being suggested. The use of symbolic chemistry is commonly introduced in secondary and advanced levels where students already have foundational concepts of chemistry and its related theories. Its later introduction is also due to the fact that much of the symbolic level is mathematically adjacent and requires students to have a working comfortability with manipulating numbers and equations outside of the chemical realm.
A primary example of the symbolic chemical language is the use of elemental symbols to represent materials in a balanced stoichiometric equation. Atomic symbols represent elements that undergo a reaction where bonds reform and are rearranged; however, nothing new is created or destroyed. Students must conceptually understand the Law of Conservation of Mass and then apply the theoretical understanding to recognize that the same amount of each element must be present on each side of the reaction arrows. The representation of this chemical reaction is one of many visualization examples that are used at the symbolic level to communicate macroscopic and microscopic topics. The symbolic language only becomes valuable once students are better oriented to the subject. Herron (1996) writes,
“The connection between symbolic representations and real-world knowledge of chemical processes is integrated for the expert, and the expert relies on experience to interpret chemical symbols and equations meaningfully. The novice lacks the knowledge to assess his or her interpretation of chemical statements, and the skill to understand and use chemical language will need to develop before the student has necessarily gained semantic knowledge.”
The task then becomes timing the introduction of the symbolic level to students. The symbolic language of chemistry should not be viewed as a complicating layer in a student’s education but used to further promote a relational understanding of chemistry themes and relationships across the other two domains.
It should be emphasized that the use of chemical symbols, formulas, and equations can be easily misinterpreted in the classroom setting due to the fact that some symbolic language can represent ideas at the macroscopic and the microscopic levels (Taber, 2009). Language, regardless of the type, must be interpreted, so it can be unintentionally misread. The symbolic level of chemistry is intended to provide the language for chemistry learners and educators to shift back and forth between what is occurring at the observable macroscopic level and the finite microscopic level. Without proper guidance it can be overlooked as a tool of interpretation and explanation for the two other levels and instead act as a barrier to learning, only contributing to student confusion.
Many of the topics studied in chemistry are abstract and are unexplainable without the implementation of analogies, models, or visual representations to guide students’ learning. This alone remains challenging for students to conceptualize abstract images that are presented to them and then accurately link them to other theoretical concepts that were previously taught. Further, students are then tasked with manipulating numbers, symbols, formulas, and equations to express relationships that were modeled to them on the microscopic and macroscopic levels. Students’ conceptual understanding of the role of each level, as well as the relationships between each level, is commonly assumed by chemistry teachers who frequently use all three levels simultaneously (Treagust et al., 2003). Teachers often assume that students can transfer from one level to another with ease (Johnstone, 1982).
Quite often, students are tested on their conceptual understanding of all three levels of chemistry but specifically through the avenue of the symbolic domain. Students are asked to coordinate information about the subject at two separate levels: in terms of the formal descriptions of the observed phenomena at the macroscopic level and regarding the theoretical models of the structure of matter at the microscopic scale (Taber, 2013). Often what this looks like on exams is a situation where a student could be asked to interpret symbolic domain questions and solve them using chunked knowledge that was taught at the macroscopic and microscopic levels. However, for novice chemistry students, it has been shown that in a variety of chemical representations and examples, introductory chemistry students only used one form of representation and rarely could transform to the others, compared to experts who were able to move between the levels with ease (Kozma & Russel, 1997).
Although it is not necessary to always integrate all three levels in teaching all the time, it remains important that educators understand the interconnected relationship between the domains so it can be better conveyed to students. When students are taught chemistry, the separation between the three levels of chemistry is not explicit but is informally implied through the exposure students are given. In one lesson alone, a teacher could begin a class with a demonstration (macroscopic), followed by a lecture explaining what is happening between molecules (microscopic), and then task students with problem solving using equations at the symbolic level without building a clear relationship between all three. Because the three levels can be interpreted in more than one way, and because teachers unwittingly move from one level to another in lecturing, students fail to integrate the levels, which leads to a fragmented view of chemistry with many puzzling parts that do not seem to fit together. Helping students relate to the three levels of representing matter has potential for improving conceptual understanding (Gabel, 1999). Educators need to create clear boundaries between each domain of chemistry so that students are able to compartmentalize information to build a more comprehensive understanding of the chemical world.
Ultimately, educators are tasked with creating academic boundaries between the three domains while also managing the timelines of their introduction. Too soon and the student is overwhelmed with unsorted information (Miller, 1968). Too late, and common misconceptions about the state of certain chemical knowledge can be misinformed due to the absence of understanding beyond the observable level. One credible tool that has been implemented within each level of chemistry teaching has been using visualization and models to explain fundamental relationships of chemical knowledge at each level. Chemistry research has continuously shown how the implementation of models, visualization tools, and other visual aids drastically influences a student’s understanding and comprehension of the topic.
However, streamlining the integration of all three domains of chemistry through visual representation remains challenging.
“Even when one student can use and understand one or more representations, he or she may not understand how the individual representations are related to one another” (Hinton & Nakhleh, 1999).
Successfully bridging all three domains through visual representation and modeling is the next natural step. Until now, visualization techniques in science education have involved a singular domain at a time to avoid confusion for students. To reduce confusion, this principle of introducing one level of chemistry at a time must remain, but further attention to how educators scaffold the relationship between each domain remains essential. If visualization tools are regarded as successful tools for each segmented level of chemistry, the implementation of visualization techniques to connect the domains together should be optimized and researched as well.
METHODS
The following data was sourced from 211 responses to an Internal Review Board (IRB)-approved student-produced survey. The surveys were collected both online during the COVID-19 pandemic as extra credit and in person at central campus locations of The City College of New York and the main science building. However, it is unclear which surveys were conducted from each source, as it was not an indicated question, or whether the method of collection influenced the quality of responses or emerging data trends. Of the total 211 collected surveys, 119 indicated they were ‘female’ and 79 ‘male,’ with 2 responding ‘other.’ The remaining left the response incomplete. The average age of those surveyed was 21.2 years old, indicative of students who have completed higher-level science courses (either at City College or previously in their academic career), one of the eligibility requirements for the survey. The data was collected from 193 participants with a survey that was approved by the IRB and in accordance with the college protocols.
The survey consisted of four Likert-scale questions (the results of which are demonstrated in Figure 1), seven multiple-choice questions, two of which contained visual prompts, and four short-answer questions. Students were prompted to complete all questions, including the short answers, to the best of their ability. Survey participation was voluntary. Once all of the surveys were collected, the data was manually entered into an Excel document where data was sorted and categorized by frequency, similarity, and demographic data points.
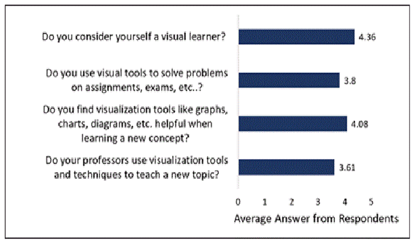
The primary motivation of the introductory Likert scale questions was to determine students’ familiarity with our quantification of visualization tools and whether visualization tools have been introduced or integrated in their academic coursework thus far. The Likert scale consisted of five options: always, usually, sometimes, rarely, and never. Always was assigned the number 5, and in descending order Never was assigned the value of 1. From each Likert question, the total of each option was counted and averaged to produce a final score number indicated in Figure 1 as a value out of 5.
According to two experts who examined the survey, the questions appropriately capture the investigation into learning difficulties and challenges students face in learning about stoichiometry and how it impacts performance. Using the test-retest method, the reliability coefficient was determined to be 0.86. A single factor ANOVA was performed on the Likert-type questions, and the results showed a substantial correlation between the variables and strong evidence against the null hypothesis (p < .001 and p < 0.05).
RESULTS AND DISCUSSION
Without offering a concrete definition of visual learning or priming students, survey respondents were asked the first question of whether they consider themselves a visual learner. From the 204 respondents, 141 students affirmed they were, with 61 choosing ‘sometimes’ and only 2 responding ‘no.’ This averaged a score of 4.36 out of 5, or 87%, with a breakdown of 69% of respondents saying ‘yes’ and 29% choosing ‘sometimes.’ To further investigate how students define visual learning, the second question, ‘do you consider yourself a visual learner?’ was prompted next. This question was chosen to understand how students identified their learning style. Did they consider themselves visual learners because of the tools they used, or did students align their learning styles through other components of their academic sessions within and outside of the classroom?
“I enjoy visualizing in my head, and I like the classes where I’m allowed to or even encouraged to use that tool; it feels more natural to me than writing things out.”
Question 3 in Figure 1 demonstrates that graphs, charts, and diagrams, as well as further visual tools, are a highly effective resource for student learners. This was the introduction of how we as researchers define visual tools for students. Although the question did not indicate when the visual tools were introduced during the pedagogical study, the average answer response was a 4.08 out of 5 score, producing an average of 82%. The quote above was taken from one of the long survey responses that asked if there were any additional information students wanted to share regarding their learning style, visualization in STEM, or other feedback. However, when asked if professors used visualization tools in academic lectures (inclusive of in-person learning or Zoom format), the average response decreased to 3.61, indicating that although helpful, the introduction of these supplemental resources does not occur as frequently in the classroom, indicating that students or their peers are supplemented with visualization tools later during their study. This result, paired with the response from the previous questions, indicates the need for professors to introduce visualization tools earlier with the introduction of new STEM topics.
To better construct a clearer landscape of how visualization tools aid or prevent students from learning the three levels of chemistry, it became important to explore where exactly students were struggling and excelling with the presented course materials. Figure 2 is divided into the separate categories, noting the types of content and tested materials. These results were taken from the open-ended response section of the survey. During data calculation, the short responses were grouped into similar categories and totaled to find trends. From the cumulative responses of each category, the top six were graphed in Figure 2, with the average percentage of each response listed next to each bar.
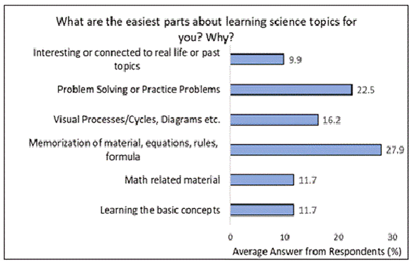
Figure 2 results showed that 27.9% of respondents found the memorization component of STEM learning to be the easiest. Roughly one-third demonstrated that rule-based formulaic STEM information was the least complicated, suggesting that the symbolic level of chemistry, the level pertaining to formulas, mathematical terms, and other representative forms, required minimal aids to solidify course material. This was followed by solving practice problems at 22.5%. Often, the colloquial term ‘plug and chug’ is used to describe the almost mindless process of substituting numerical values into equations or adhering to strictly prescribed guidelines by professors when solving practice problems.
“Diagrams and charts to categorize information in STEM classes are also helpful because they also help to draw important comparisons in the content that is being taught.”
The third leading category was visual processes, diagrams, and cycles with a 16.2% response rate. It is significant to note that it was not the use of visual aids and models that made the topic easier, but the topic itself was visual in nature, whether the cyclical steps in a chemical reaction or visuospatial memorizing for anatomy, which was easier for 16% of students than other components of coursework. During the survey students were asked. ‘When learning something new, which medium do you start with to get familiar with the topic?’ Of the 182 answers collected, 80 indicated video examples, nearly 44%.
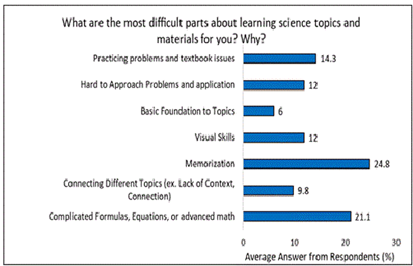
Interestingly, and as shown in Figure 3, the areas that students expressed as the easiest parts of learning science topic materials were also indicated as the hardest parts. Memorization was the highest recorded area that posed difficulty for students at 24.8%, followed by complicated formulas, equations, or advanced math at 21.1%. The next highest category was similar to the results of Figure 2, with practice problems and textbook issues yielding 14.3%. These three categories amount to two-thirds of the overall response to this question. These results indicate the need to investigate the parts of each topic that students find challenging or easy and to determine how and if visual tools were introduced, if at all. This sequence of questions has allowed us to determine the types of learners present and their strengths and weaknesses.
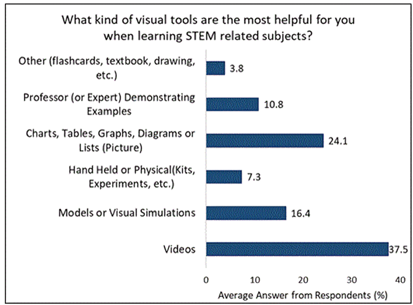
The final trend is reflected in Figure 4. It asked students what kind of visual tools are the most helpful when learning STEM-related subjects. Since the definition of visual aids and models encompasses a broad possibility of answers, it was important to define the types of tools that students found most useful in their comprehension of science topics. Figure 4 demonstrates that 37.5% of students found videos to be the predominant method of external resources that helped them in their studies. This was followed by 24.1% of students expressing that charts, tables, graphs, or lists (pictures) were the most useful to them. This trend suggests that students can gain a better comprehension of the information when it is presented to them holistically (long-form explanation) rather than using handheld model kits (7.3%) and physical demonstrations (10.8%) to demonstrate a particular concept. Handheld model kits often fall short of demonstrating content beyond the microscopic domain, similar to how physical demonstrations construct an understanding of the macroscopic domain but do not showcase the relatedness to the symbolic or microscopic domain without professorial guidance.
When asked to pick a type of learning style that works best for them, 125 students of 198 respondents chose visual learner, over 27 kinesthetic, and 33 indicated reading/writing. 63% of students identify as visual learners, and yet it is unclear how visual models, diagrams, and representations are being integrated into the classroom and coursework to produce a synchronous concept of chemical learning.
“Moving visuals work best. Colored diagrams are good too.”
When asked in the survey about the three levels of chemistry representation, i.e., the macroscopic, microscopic, and symbolic, only 58 of 201 students responded ‘yes,’ while another 60 responded ‘yes, but do not know what they mean.’ Students are problem-solving and memorizing information without a deeper construction of the interrelatedness of the expected information. These assignments morph into mindless tasks when students rely on rote memorization and use the rules provided to them in lectures to solve assigned problems. As educators, we are guiding students with visual aids and examples to solidify knowledge at each individual level without threading the academic needle between them, ultimately failing students as future science professionals to think beyond the presented information. We are missing the ‘why’ in STEM pedagogy, forcing science learners to construct conclusions for macroscopic, microscopic, and symbolic concepts independently, resulting in visual models and aids being used to solidify, not bridge, the conceptual divide.
CONCLUSIONS
The following study began as an introductory look into how visualization in STEM learning can be improved for college-level chemistry students but serves as an exploration of how visual tools in STEM classrooms can work to aid some students in their academic careers while also contributing to further gaps between the three levels of chemistry representation. The data suggests that when visual learning and the subsequent aids were used in academic settings were not always useful even to students who self-identified as visual learners. The results of this research prompted a twofold response: first, the need for an additional survey exploring the timing of the introduction of visual aids in the classroom along with which type, and second, the unveiling of the disconnect between the three levels of chemistry as synchronous interrelated systems rather than independent parts of a student’s academic career.
Visual tools were vital for students in understanding topics at specific levels, whether it be diagrams of organic chemistry reactions at the microscopic level or physical demonstrations of a color change at the macroscopic, but often were not the source of cohesive learning and mending of the components in unison. Visualization tools focus on specific points of chemical learning but tend to flatten or overemphasize particular components of processes in their attempt to assist intermediate, pre-professional students in comprehending the complex subject at hand. The subjective nature of visual interpretation and the type of visual tools used by educators can be examined and refined to best assist students. Future iterations of this study as well as extended research in the different areas of our results can be beneficial for both the pedagogical STEM field and the science learner.
Author contributions: IIS: conceptualization, supervision; LW: investigation, writing – original draft; MKE: writing – review and editing. All authors agreed with the results and conclusions.
Funding: No funding source is reported for this study.
Ethical statement: This study was approved by the Human Research Protection Program Ethics Committee at the City College of New York of the City University of New York on 23 November 2021 with approval code 2021-2116-CCNY. The Institutional Review Board obtained ask for oral consent since there were no names or identifiers collected from participants.
AI statement: The authors stated that AI was not used for this research study.
Declaration of interest: No conflict of interest is declared by the authors.
Data sharing statement: Data supporting the findings and conclusions are available upon request from the corresponding author.
References
- Barnea, N., & Dori, Y. (1999). High-school chemistry students’ performance and gender differences in a computerised molecular modelling learning environment. Journal of Science Education and Technology, 8(4), 257-271. https://doi.org/10.1023/A:1009436509753
- Bransford & M. S. Donovan (Eds.). (2005). How students learn: History, mathematics, and science in the classroom. National Academy Press.
- Bruner, J. S. (1966). Toward a theory of instruction. W. W. Norton & Company.
- Eilks, I., Witteck, T., & Pietzner, V. (2012). The role and potential dangers of visualisation when learning about sub-microscopic explanations in chemistry education. CEPS Journal: Center for Educational Policy Studies Journal, 2(1), 125-145. https://doi.org/10.26529/cepsj.398
- Gabel, D. (1999). Improving teaching and learning through chemistry education research: A look to the future. Journal of Chemical Education, 76(4), Article 548. https://doi.org/10.1021/ed076p548
- Grosslight, L., Unger, C., Jay, E., & Smith, C. L. (1991). Understanding models and their use in science: Conceptions of middle and high school students and experts. Journal of Research in Science Teaching, 28(9), 799-822. https://doi.org/10.1002/tea.3660280907
- Herron, J. D. (1996). The chemistry classroom: Formulas for successful teaching. American Chemical Society.
- Hinton, M. E., & Nakhleh, M. B. (1999). Students’ microscopic, macroscopic, and symbolic representations of chemical reactions. The Chemical Educator, 4(5), 158-167. https://doi.org/10.1007/s00897990325a
- Hitt, A. M. T. (2006). Getting to the core issues of science teaching: A model-based approach to science instruction. Science Educator, 15(1), 35-43.
- Hoffmann, R., & Laszlo, R. (1991). Representations in chemistry. Angewandte Chemie International Edition in English, 30(1). https://doi.org/10.1002/anie.199100013
- Jaber, L. Z., & BouJaoude, S. (2012). A macro-micro-symbolic teaching to promote relational understanding of chemical reactions. International Journal of Science Education, 34(7), 973-998. https://doi.org/10.1080/09500693.2011.569959
- Johnstone, A. H. (1982). Macro- and micro-chemistry. School Science Review, 64(227), 377-379.
- Johnstone, A. H. (1991). Why is science difficult to learn? Things are seldom what they seem. Journal of Computer Assisted Learning, 7(2), 75-83. https://doi.org/10.1111/j.1365-2729.1991.tb00230.x
- Johnstone, A. H. (2007). Science education: We know the answers—Let’s look at the problems. Teaching of Natural Sciences and New Technologies in Education, 5(A).
- Kozma, R. B., & Russell, J. (1997). Multimedia and understanding: Expert and novice responses to different representations of chemical phenomena. Journal of Research in Science Teaching, 34(9), 949-968. https://doi.org/10.1002/(SICI)1098-2736(199711)34:9<949::AID-TEA7>3.0.CO;2-U
- Kozma, R., & Russell, J. (2005). Multimedia learning of chemistry. In R. Mayer (Ed.), The Cambridge handbook of multimedia learning (pp. 409-428). Cambridge University Press. https://doi.org/10.1017/CBO9780511816819.027
- Larkin, J., & Simon, H. A. (1987). Why a diagram is (sometimes) worth ten thousand words. Cognitive Science, 11(1), 65-100. https://doi.org/10.1016/S0364-0213(87)80026-5
- Miller, G. A. (1968). The magical number seven, plus or minus two: Some limits on our capacity for processing information. In G. A. Miller (Ed.), The psychology of communication: Seven essays (pp. 21-50). Penguin.
- New Oxford American Dictionary. (2021). New Oxford American Dictionary [Computer software]. Apple. https://www.oxfordreference.com/abstract/10.1093/acref/9780195392883.001.0001/acref-9780195392883
- Noh, T., & Scharmann, L. C. (1997). Instructional influence of a molecular-level pictorial presentation of matter on students’ conceptions and problem-solving ability. Journal of Research in Science Teaching, 34(2), 199-217. https://doi.org/10.1002/(SICI)1098-2736(199702)34:2<199::AID-TEA6>3.0.CO;2-O
- Taber, K. S. (2009). Learning at the symbolic level. In J. K. Gilbert, & D. Treagust (Eds.), Multiple representations in chemical education. Models and modeling in science education, vol 4 (pp. 75-105). Springer. https://doi.org/10.1007/978-1-4020-8872-8_5
- Taber, K. S. (2013). Revisiting the chemistry triplet: Drawing upon the nature of chemical knowledge and the psychology of learning to inform chemistry education. Chemistry Education Research and Practice, 14(2), 156-168. https://doi.org/10.1039/C3RP00012E
- Treagust, D. F., & Harrison, A. G. (1999). The genesis of effective scientific explanations for the classroom. In J. Loughran (Ed.), Researching teaching: Methodologies and practices for understanding pedagogy (pp. 28-43). Taylor & Francis. https://doi.org/10.4324/9780203487365-5
- Treagust, D., Chittleborough, G., & Mamiala, T. (2003). The role of submicroscopic and symbolic representations in chemical explanations. International Journal of Science Education, 25(11), 1353-1368. https://doi.org/10.1080/0950069032000070306
- Tsui, C.-Y., & Treagust, D. (2004). Motivational aspects of learning genetics with interactive multimedia. The American Biology Teacher, 66(4), 277-285. https://doi.org/10.2307/4451670
- Tuysuz, M., Ekiz, B., Bektas, O., Uzuntiryaki, E., Tarkin, A., & Kutucu, E. S. (2011). Pre-service chemistry teachers’ understanding of phase changes and dissolution at macroscopic, symbolic, and microscopic levels. Procedia – Social and Behavioral Sciences, 15, 452-455. https://doi.org/10.1016/j.sbspro.2011.03.120
- Williamson, V. M. (2011). Teaching chemistry with visualizations: What’s the research evidence? In M. S. Cooper, & S. E. Lewis (Eds.), Investigating classroom myths through research on teaching and learning (pp. 65-81). American Chemical Society. https://doi.org/10.1021/bk-2011-1074.ch006
- Williamson, V. M., & Abraham, M. R. (1995). The effects of computer animation on the particulate mental models of college chemistry students. Journal of Research in Science Teaching, 32(5), 521-534. https://doi.org/10.1002/tea.3660320508
How to cite this article
APA
Salame, I. I., Wagner, L., & Khedr Elkelany, M. (2026). Examining the value of visualization teaching aids as to bridge the multiple levels of chemistry learning. Interdisciplinary Journal of Environmental and Science Education, 22(3), e2619. https://doi.org/10.29333/ijese/19007
Vancouver
Salame II, Wagner L, Khedr Elkelany M. Examining the value of visualization teaching aids as to bridge the multiple levels of chemistry learning. INTERDISCIP J ENV SCI ED. 2026;22(3):e2619. https://doi.org/10.29333/ijese/19007
AMA
Salame II, Wagner L, Khedr Elkelany M. Examining the value of visualization teaching aids as to bridge the multiple levels of chemistry learning. INTERDISCIP J ENV SCI ED. 2026;22(3), e2619. https://doi.org/10.29333/ijese/19007
Chicago
Salame, Issa I., Lindsey Wagner, and Maya Khedr Elkelany. "Examining the value of visualization teaching aids as to bridge the multiple levels of chemistry learning". Interdisciplinary Journal of Environmental and Science Education 2026 22 no. 3 (2026): e2619. https://doi.org/10.29333/ijese/19007
Harvard
Salame, I. I., Wagner, L., and Khedr Elkelany, M. (2026). Examining the value of visualization teaching aids as to bridge the multiple levels of chemistry learning. Interdisciplinary Journal of Environmental and Science Education, 22(3), e2619. https://doi.org/10.29333/ijese/19007
MLA
Salame, Issa I. et al. "Examining the value of visualization teaching aids as to bridge the multiple levels of chemistry learning". Interdisciplinary Journal of Environmental and Science Education, vol. 22, no. 3, 2026, e2619. https://doi.org/10.29333/ijese/19007